How to build a histogram in Excel and Word
No one will dispute what the histogram is -this is a good tool for visual data display. Only looking at such a diagram, you can give an estimate of the situation in the shortest possible time, without resorting to analyzing the numerical values in the table. That's why the world-famous spreadsheet editor Excel has adopted this tool.
The article will tell you how to buildhistogram in Excel. Four methods of construction will be disassembled, each of which differs sufficiently from one another. That's why it's worth reading up the article to the end to choose a method for yourself. At the end of the article, an example of the construction of a histogram in the "Word" will also be given.
Building a histogram

In Excel, you can build a histogram in three ways:
- using a special tool;
- using conditional formatting;
- with the help of add-ins.
Now we'll look at all the ways how to build a histogram in Excel. By the way, it can be formed in different ways - to be part of a certain cell or as a separate object.
The first way: constructing a regular histogram
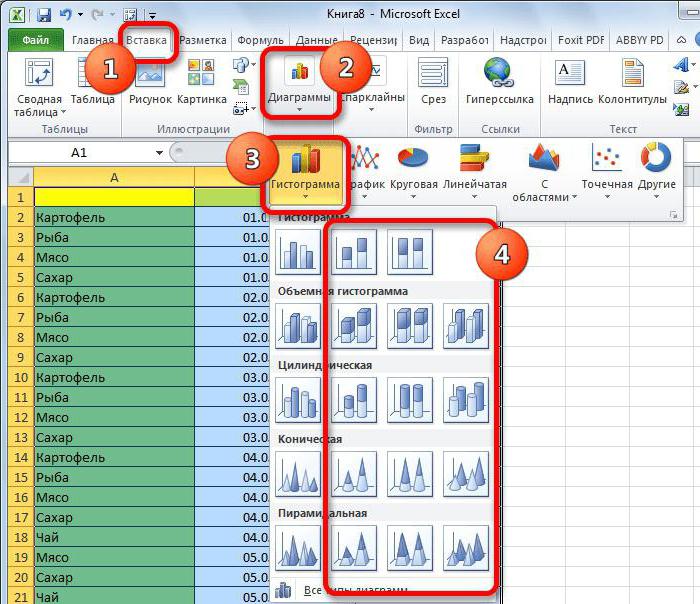
Construction begins with a selection of the areatable, the values of which will be displayed in the future histogram. Once the selection has been made, you need to go to the "Insert" tab. In it, you need to click on the "Histogram" button, which is in the "Diagrams" area.
As a result, you will have a detailed list in which you need to select one of the diagrams. By the way, the usual histograms are placed first in the list.
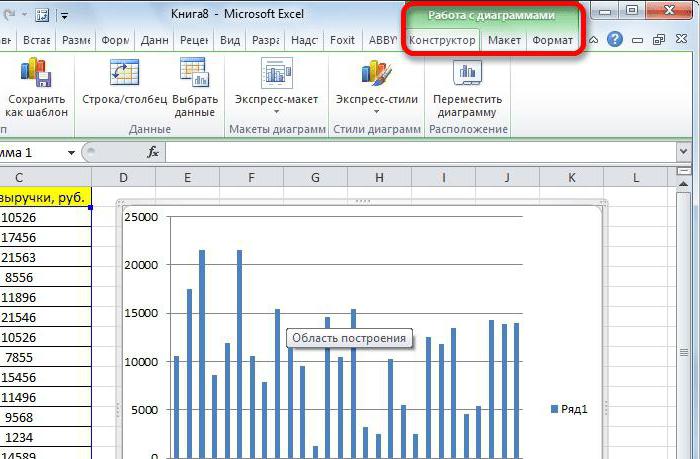
After selecting in Excel, the necessaryoption, and on this construction can be considered finished. However, you can edit the histogram using tools that are located in a group of tabs called "Working with charts."
The second way: construction with accumulation
As in the first method, we need a dedicatedtable. The histogram in this case is constructed a little differently. The first thing you need to pay attention to is the names in the header: they should not be. Otherwise, nothing happens.
After the selection, you must also go totab "Insert", click on the "Diagrams" button and in the drop-down menu "Histogram" select the one you are interested in. It should be noted that the histograms with accumulation are on the right side of the list.
Selecting one of the elements on the sheet of the documentyou will see a graph. The histogram, as in the previous method, can be changed at your discretion, for this, also use the tools that are located in the group of tabs "Working with diagrams".
The third way: building using add-ins
Now let's proceed to the third method, how to build a histogram. It consists in using a special analysis package.
The first step is to activate this package. To do this, you need to initially click on the "File" button in the program. Then on the sidebar go to the "Options" section. Now find the "Add-ons" item and select "Excel Add-ins" from the "Management" drop-down list. After that, click the "Go" button.
Before you open the window of add-ons, in which you need to tick the "Analysis package" and click "OK."
So, the analysis package is activated. Now the construction of the histogram is carried out in the "Data" tab - go there.
On the toolbar, click on the button"Data analysis", located on the right side in the "Analysis" area. A window appears in which you want to highlight the "Histogram" item and click "OK".
A new window will appear where you need to setparameters of the future diagram. In the "Input interval" field, you need to specify the area of the table whose data will be used for the build. After that, check the box next to "Display Graph". Now you just need to specify where this graph will be displayed. There are three options - on a new workbook, a new sheet or on this sheet. After the settings have been set, click "OK."
As a result, the histogram plot will be displayed in the place indicated by you.
The fourth way: constructing with conditional formatting
The fourth way, how to build a histogram, is radically different from all the above. At the end of his analysis you will see for yourself.
Initially, as in the previous times, you needSelect the area of the table whose data will be used for the build. Once this is done, go to the "Home" tab and on the toolbar open the "Conditional Formatting" drop-down list. In it you need to find the item "Histograms" and in the appeared window choose the type of histogram. There are two options: with a gradient fill and with a solid. There is practically no difference in them, so when choosing you can orient yourself to your own taste.

Once you select the type of histogram, it will appear in certain cells as a fill line.
Building a histogram in the "Word"
Now let's figure out how to make a histogram in the "Word". In essence, the process of its creation differs little from "Excel", but about everything in order.
Initially, specify by clicking the left mouse button,The place where you want to insert the histogram. After that, go to the "Insert" tab and in the "Illustrations" area click on the "Insert Chart" button - the same window will appear.
In the window on the sidebar, select the category"Histogram", and on the right side determine the type of histogram. As you can see, there are both normal and cumulative, - choose the one you need and click "OK".
On the "Vorda" sheet, your histogram will appear. Note that under it there will be a small "Excel" table for data entry. Set the necessary variables and enjoy the result.

Now you know how to make a histogram in the Word. It should be noted that this is not more difficult than in "Excel".
</ p>>